


Opus 28: America Inc.
A stock report on America Inc. the business

“As always, the public is beginning to understand the need for reform after the same public has been fleeced out of millions of dollars.” - Franklin Delano Roosevelt, 1932 Campaign Address
Introduction
On October 16th, 2008, Warren Buffet wrote an op-ed in the New York Times titled “Buy American. I am.” In it, Buffet brought his usual voice of reason and calm to the market in an effort to stabilize the financial world. While the effect wasn’t immediate - the market continued to fall 25% over the next 5 months - it was a plea to other Americans that it was time to step up and support the American economy, markets, and country as a whole. Eventually, things did turn around. Since that op-ed in 2008, the U.S. equity market has increased more than 700%, outpacing almost every other market globally. If you had listened to Mr. Buffet and bought American, you would have done quite well.
Let’s read Buffet’s headline literally rather than figuratively. Would you buy America Inc. today if you could become a shareholder?
We talk about the U.S. government, or all governments, as these nebulous webs of things, people, and institutions. We separate them from all other businesses and institutions as “The State” and split them into an individual class of organizations. However, the government is a business at its core. It's not a business like many would envision - a far cry from the locally-owned coffee shop on your corner. Nonetheless, it has financials, customers, employees, stakeholders, and all of the other components that make up a business. We hear the pundits speak about budget deficits, zero-based budgeting, spending bills, and many other topics that few fully understand. The government has money coming in (revenue), money going out (expenses), investments (capital expenditure), and funding sources (US Government debt) just like any other business. Governments are unique in that their shareholders (citizens) are also oftentimes their primary customers (tax-paying citizens).
I am not naive in believing that a government does not, and arguably should not, have the same sole aim that a business has: maximize long-term shareholder value. People far smarter than I have been writing for time immemorial about the purpose of government. The fundamental purpose of government evolves over time and even differs between countries and cultures simultaneously. I am not here to debate that specific point but rather to share some basic facts about where the U.S. government currency stands financially. Unfortunately, the real world has financial constraints. Governments must come to terms with these eventually even if they believe they are immune.
I'm writing this post to strip away all the jargon and hand-waving discussions around Government spending, funding, efficiency, and other topics. Let’s look at the U.S. government, and others for comparison, as businesses.
The Product & Customer
I want to change the wording many use to describe the government. We often say “government expenditures” to describe everything the government provides. But these services, products, infrastructure, and other items are actually products from the viewpoint of the citizens who pay for them. We citizens, or taxpayers more specifically, are buying products and services from our government. So, what do we get every year as customers of the government?
The U.S. government currently has 331,000,000 customers (citizens) and by almost every measure it is the largest business in the world. With $4.5 trillion in annual revenue at the federal level and another ~$2 trillion at the State and local levels, the U.S. government is over 10x the size of the largest company by revenue in the world, Walmart. And while we all know Walmart sells a lot of products, the U.S. government certainly sells many more.
The U.S. government sells healthcare services through Medicare, Medicaid, CHIP, the VA, and other programs. It sells ~$1.5 trillion across these categories, which equates to ~$4,500 per American every year.
The U.S. government sells retirement funding for the ~68 million Americans over the age of 65 who draw on the pension pool. It provides supplementary income through Social Security benefits. At ~$1.4M trillion, this program alone accounts for over 1/5th of all the products “sales” the U.S. government does annually. That comes out to ~$24,000 per year for every senior citizen in America.
The U.S. government sells protection through the military and law enforcement. On the federal level, the government sells ~$820 billion in military services every year, or $2,500 for every citizen. This $2,500 buys the average American active-duty military protection, military infrastructure, weapons, logistics, and administrative costs. An additional ~$500 per year is sold to every American at the S&L level through police and local law enforcement.
The U.S. government sells (technically, this is an investment by the government if we are taking a literal accounting view) infrastructure, including roads, bridges, water utilities, broadband connectivity, power generation, airports, and other significant projects. In 2023, the federal government invested $362 per American on these projects, including transfers to the States, which manage many of these projects more locally.
It is astounding how little the government sells outside of these five main areas. The first three (Healthcare, Social Security, and Defense) are the only material categories. Everything else is a rounding error. The federal government sold $72 billion worth (~1% of its budget) of foreign assistance to various countries around the world. Only $22.6 billion worth of products and services were provided to the American people in the form of NASA-related work (~0.5%). Unemployment benefits make up a tiny $40 billion / year.
What does the U.S. government get in exchange for all of these products? The average U.S. taxpayer pays the U.S. government ~$18,000 a year of which $13,725 went to the federal government. If ranked as a single expense for the average American, income tax would count as the second largest expense per year only behind housing costs in the form of a mortgage or rent. Roughly half of these mortgages are owned by Fannie Mae and Freddie Mac which are government sponsored / semi owned. So, for most Americans, the business they spend the most money at every year is America Inc. across various spending categories. Which brings us to the next section: America Inc’s income statement.
The Income Statement
A government’s revenue base can be as diverse as any business’s. Most wealthy countries source their federal government revenues from personal income taxes due to the sheer earning power of their population and because taxing at the “revenue” level of personal income is a much bigger pool of money than a VAT or excise tax which is an expense of people. This is an obvious yet often ignored point - people are taxed on their revenue while businesses are taxed on their net income. I will generally focus on federal level budgets for this section rather than state and local as it complicates things when you compare federalist vs. centralist governing systems and budget figures across countries.
The U.S. Government receives ~50% of its annual federal income from personal income taxes and another 36% in the form of payroll taxes such as Social Security, Medicare, Medicaid, etc. A measly ~9% of the federal budget comes from corporate income taxes. Almost everything else (tariffs & customs duties, estate & inheritance taxes, etc.) combined only funds 5% of the budget.
It wasn’t always this way. The U.S. government’s revenue base has evolved drastically over its 250-year history. At the start of the 20th century, the federal government’s main tax revenue came from tariffs and excise taxes on alcohol, tobacco, etc. federal income tax on individuals was actually illegal due to the Supreme Court’s decisions on Pollock vs. Farmers’ Local & Trust Co and was only ratified with the 16th constitutional amendment in 1913. At the State & Local level (S&L), governments funded themselves through property taxes, some minor contributions from license fees, and excise taxes on alcohol, tobacco, and firearms. Today, Trump is ramping up tariff talk in the United States, which I find odd as today, these tariffs only account for 1.5% of the annual federal income. If the U.S. were to return to the budget composition it had back in 1900, Trump would need to put a 100% tariff on all imported goods (~$3.2 trillion). Trump’s tariff activity is clearly not an effort to balance the budget but rather a negotiating tool to begin other unrelated conversations with countries.
Before 1940, the federal government did next to nothing economically. Only in 1940, as WWII scaled up, did the U.S. federal government account for more than 10% of all economic activity. In the early years of the 19th century, the government only powered 2-5% of GDP. In the first official dataset from 1902, S&L governments collected over $1 billion in tax revenues while the federal government only collected $600 million. This ratio between the federal and S&L governments is flipped today with the S&L governments only collecting <50% of what the federal government takes in annually. Almost every federalist government in the world experienced the same evolution over the last century with federal and national governments taking a majority of tax revenues for the country while state, provincial, and local governments have shrunk in relative size. The only country this has not happened in is Switzerland - yet another characteristic that sets Switzerland apart from all other nations as I wrote about here. Today, Switzerland is the only country in the world where the federal government is a smaller financial body than the state and local governments, or cantons as they’re called in Switzerland.
Looking abroad, the U.K. federal government gets 41% of its annual budget from income taxes and 15% from VAT / sales taxes. The U.S. government does not elect to levy sales taxes at a federal level. Instead, it allows States to individually decide, with some choosing no sales tax and others, such as California, setting sales taxes as high as 7.25%. The U.K. almost matches the U.S.'s corporate tax level at 8.5% of the annual budget. The remaining 35% is diversified across capital taxes, fuel duties, tariffs, and other receipts. France sees 57% of its federal budget come from personal taxes, payroll taxes, and social security. Only 6% of the budget comes from corporate taxes and the balance is mostly coming from VAT / sales taxes (26%).
Developing countries have very different budget compositions. India’s budget is much more balanced with corporate taxes, personal income taxes, and sales taxes making up ~30% each of the federal government’s tax revenue base. Brazil and its South American peer group owe a lot to the sales taxes (GST as they call it), with 20-25% of the budget being funded by these transaction-related levies. Indonesia relies heavily on corporate income taxes. Here is a breakdown of the largest revenue source for the 40 largest governments:

There are plenty of extreme budget examples around the world. Oil constitutes an eye-watering 89% of Kuwait’s government budget. Many small island nations rely on fishing license revenues from commercial fishing operations or mining royalties. In the poorest nations such as Sudan, Somalia, and Yemen, the governments relied on foreign assistance, namely USAID before it was dissolved, to fund upwards of 50% of its government revenues. Bhutan even mines Bitcoin! The moral of the story is that there are a nearly infinite number of ways governments can fund themselves, and the composition has changed drastically over the years.
Now let’s move to the expenses (returning to the usual wording of government expenditure) section of the P&L. This is the area of the U.S. government that the now infamous DOGE is most focused on. I am not writing this post to convince you that the DOGE is a force of good or evil but it has forced people to pay attention to government spending more than ever. Elon and his team have already made drastic changes to the government by deleting entire agencies, stopping payments, and offering employees buyouts. Let’s begin with the personnel question.
Does the U.S. government employ too many people?
Best estimates place direct federal employment at ~4.3 million people, with an additional 3.5-4.5 million contractors and indirectly employed people. State and Local governments employ another ~18 million people across the 50 states.
U.S. businesses in the private sector collect ~$150,000 - $250,000 in annual revenue per employee. There are exceptional cases in the financial services and legal industries where this figure is well north of $1M / employee. Comparing this to a government is not a perfect measuring tool as governments don’t need to go and sell their products through a sales team or marketing. Citizens, for the most part, do not need a lot of proactive outreach or convincing to pay their taxes. No businesses can say, “buy our products, otherwise you go to jail” like the government can. Regardless, it is a useful exercise to compare the revenue per employee just to see directionally where the government stands in terms of efficiency.
The federal government collected $4.92 trillion in 2024. Using very basic assumptions, this would place revenue per employee at $1.14M with just direct employees and $545K if you include contractors and indirect personnel (military, postal workers, etc.). Again, this is not a perfect analogy given governments have drastically different organizational structures and human capital demands given the nature of what they do. There is some beautiful irony in the fact that Elon’s Tesla does $97B in revenue with 125,000 employees, implying a revenue per employee of ~$780,000… not that impressive compared to the government!
How does the U.S. government stack up against its peers? Adjusting for local purchasing power, here are the other ten major governments’ revenue per employee and also including contractors:
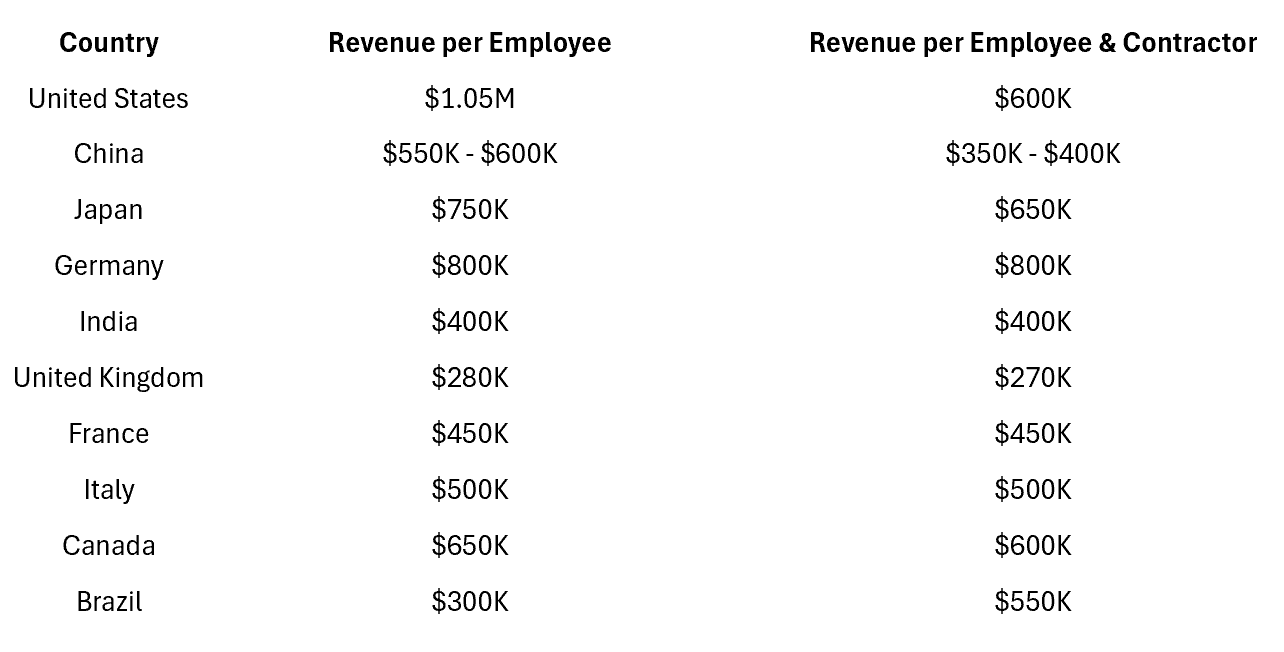
At a very high level, one could argue that the U.S. federal government is the most efficient government in the world as measured by its overall return on employees. It is odd that DOGE is focusing on excess employment when this is not the core issue of the government. The spending within mandatory categories (Social Security, Medicare, Medicaid, Defense, etc) is the real issue. If Elon and his team cut everything out of the government except social security, medicare, medicaid, and defense and still the government would not be producing a surplus. Budgets for NASA, the parks system, all infrastructure spending, unemployment, postal services, disaster relief, foreign assistance, the Department of Agriculture, the TSA, the Department of Transportation, Energy, and every other program and Department could disappear and the government would still be bleeding. This is an extraordinary thing to think about. DOGE has declared the main categories of mandatory spending outlined above as being untouchable and safe from any cuts but these are the only programs that matter in the end.
It is equally shocking to just stop and appreciate how few governments run fiscal surpluses. IMF data for 2023 and 2024 suggests that only 6 European countries (Norway, Denmark, Ireland, Portugal, Montenegro, and Switzerland) ran budget surpluses in either year. Most other countries are oil / energy powers (Kuwait, Libya, Azerbaijan, Qatar, UAE, Turkmenistan, etc.) or micro economies that saw a massive rebound in tourism. Almost all economies of consequential size torch money year after year. This is not a revelatory news headline for many but it warrants real appreciation for what is happening. As citizens, or shareholders to extend the analogy introduced at the start, this only hurts us.
The last area that many are beginning to talk about has long hung over our heads and that is the interest costs to the U.S. government as a result of the extraordinary amount of debt the government has taken on. For that, though, we will turn to the balance sheet.
The Balance Sheet
The analysis of capital structures within the business world could fill many careers worth of study. Academics have long argued the optimal level of debt vs. equity. Equity structures come in every color of the rainbow and the only limitation is one’s imagination. Accounts receivable factoring, AP days payable, inventory financing, and plenty of other products are available to fund day-to-day operations. There is the finance fun fact that Starbucks has ~$2.2 billion as of 2024 in outstanding gift cards and prepaid app deposits that they can use as 0% interest financing. As of their last 10Q, this amount alone accounts for 22% of their current liabilities.
But governments principally have only two ways to fund themselves: tax revenues and debt. There are a handful of governments that have large state-owned enterprises that transfer profits to the government - Saudi Arabia’s Aramco being the most well-known which funds more than half of the Kingdom’s budget. Then there are the few exceptional countries like Norway, which have built up large sovereign wealth funds that have reached such massive size that they can now fund substantial portions of the annual budget while still growing. These again are exceptions, not the rule, and most governments must rely on taxes and debt.
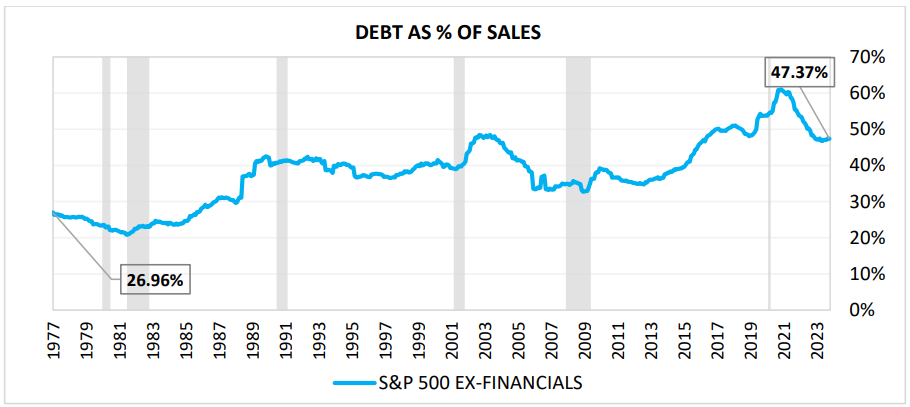
Looking to the private sector, American businesses have levered themselves considerably over the last 50 years. The long decline of rates and the increase in profit margins (~4.5% in 1983 to 11.5+% today for the S&P 500) also allowed lenders to get comfortable with more debt. Today, the average S&P 500 business is levered ~1.5x to equity and holds debt equivalent to 47% of sales. U.S. non-bank corporations pay an average 1.5-2.25% of sales in interest expense on their debt. The effective interest rate is somewhere around 4-4.5% in recent years - this is due to a large amount of debt being fixed rate raised during the zero interest rates era.
The U.S. government is, unsurprisingly to most, very leveraged compared to its business peergroup. Many quote “debt to GDP” as the common measurement of a government’s indebtedness. Federal debt to GDP currently stands at 120% for the U.S. which is only behind Japan (250%), Greece (168%), Venezuela (145%), and Italy (134%). But, if we want to compare apples to apples, we should quote debt to government revenues as the “debt” we are referring to is public debt (federal in this case) and is not serviced by the broader economy. Also, it is important to consider that every economy has different levels of government involvement so comparing government debt to GDP is not appropriate.
If we compare the “government debt to revenues” in order to compare it to private business leverage, then this figure is much higher at 636% ($36 trillion public debt / $4.9 trillion federal government revenues). Compared to the businesses in the S&P 500, the government itself is 13.5x more leveraged. In fact, save for the Japanese federal government at 10-15x leverage, the U.S. government is the most indebted entity in the world on both a relative basis and certainly an absolute basis. Its obligations and liabilities to both domestic and international counterparties are nearing $45 trillion at current marks:

It is an interesting side note to consider: what is the most indebted entity in the world relative to its earning power? Most of the notoriously indebted U.S. states - Illinois, California, etc. - all have relatively reasonable debt loads when you consider their tax collections. If you combine Illinois’s state debt with its unfunded state pension liabilities, you get a total revenue-to-liability ratio of 6-7x. The heavily indebted cities - NYC, Detroit, etc. - again are all within 1-2x leverage of their city-level tax revenue levels. These cities are also in a unique position in that they can garner state and federal support if push comes to shove. There are probably some historical examples of global governments that took hard currency debt in USD or EUR and saw a massive devaluation in their local currencies, leading to extraordinary leverage. There are other infamous examples, such as Greensill, Evergrande, Petrobas, etc., but none of these were near the debt levels of the U.S. government.
The U.S. government’s debt maturity schedule is a timely subject. Nearly $7 trillion, or roughly 25% of total outstanding debt, is coming due over th next 12 months across various tenures. The weighted average interest rate on these maturing claims is 3.2-3.3% so as the government rolls and refinances the debt, effective rates on the total debt load will increase substantially with the current yield curve being more expensive across the yield curve.
Buy, Sell, or Hold America Inc.?
So, what to think? From a financial standpoint, the U.S. government is stuck between a rock and a hard place. No politician dares to do the rational thing on either side of the P&L - raising taxes is a sin and cutting mandatory spending is both unpopular and legally a massive process given the prior commitments by the government. The timely news on February 19th that the U.S. government is looking to cut back taxes more than they are reigning in the spending is further evidence of this conundrum.
If America Inc. were an actual business it would be the most unhealthy company in the world buried in debt with no change on the horizon. The luxuries that comes with being the global hegemon and reserve currency lead to unsustainable behavior.
The legislative and executive parts of the government, together with the American people, will need to reckon with hard decisions. The government is here to serve its citizens and should do everything it can within its financial means to provide for them. But, financial constraints are a real thing that eventually come into play.
Sources:
I was going to in-line source everything but nearly the entire post become red text from all the linking. So instead, I put it all here.
Much of the analysis above was done using OpenAI’s Deep Research functionality and the following resources:
https://obr.uk/forecasts-in-depth/brief-guides-and-explainers/public-finances/
https://www.mof.gov.kw/MofBudget/PDF/Budget20-19eng.pdf
https://www.indiabudget.gov.in/doc/Budget_at_Glance/bag1.pdf
https://www.aft.gouv.fr/en/state-budget
https://fiscaldata.treasury.gov/americas-finance-guide/government-revenue/
https://www.pogo.org/analysis/contractors-and-true-size-of-government
https://usafacts.org/state-of-the-union-2023/budget/
https://pages.stern.nyu.edu/~adamodar/New_Home_Page/datafile/Employee.html
https://usafacts.org/state-of-the-union/transportation-infrastructure/
https://home.treasury.gov/news/featured-stories/infrastructure-investment-in-the-united-states
https://usafacts.org/articles/how-much-does-the-us-spend-on-the-military/
https://files.taxfoundation.org/legacy/docs/FF415.pdf
https://taxpolicycenter.org/briefing-book/what-are-sources-revenue-federal-government
https://taxfoundation.org/data/all/federal/latest-federal-income-tax-data-2025/
https://www.mof.gov.kw/MofBudget/PDF/Budget20-19eng.pdf
https://usafacts.org/articles/average-taxes-paid-income-payroll-government-transfers-2018/
https://taxfoundation.org/data/all/federal/latest-federal-income-tax-data-2025/
https://www.statista.com/statistics/204535/number-of-governmental-employees-in-the-us/
https://www.osam.com/pdfs/research/Climbing%20the%20Maturity%20Wall%20of%20Worry.pdf
https://www.imf.org/external/datamapper/GG_DEBT_GDP@GDD/CAN/FRA/DEU/ITA/JPN/GBR/USA
https://fred.stlouisfed.org/series/QTAXTOTALQTAXCAT1USNO
https://www.downsizinggovernment.org/defense-and-veterans-spending-tops-12-trillion
https://www.ssa.gov/oact/STATS/OASDIbenies.html
https://tax.illinois.gov/research/taxstats.html
https://reason.org/transparency-project/debt-trends-state-local/state/
https://budgetmodel.wharton.upenn.edu/issues/2025/1/27/complete-measures-of-us-national-debt
https://budgetmodel.wharton.upenn.edu/issues/2025/1/27/complete-measures-of-us-national-debt
https://d18rn0p25nwr6d.cloudfront.net/CIK-0000829224/47544d52-f263-4368-b87e-7bd324898883.pdf
Derek, Marvelous piece and a very different take on the whole problem. I think this will help people get a better fix on this morass. And they were NOT smarter than you...
Your blog posts are inspiring